What is Business Intelligence?
Business Intelligence defines the technologies, functions, and systems for the collection, integration, analysis, and demonstration of business data and sometimes to the data itself. The purpose of business intelligence is to provide better business decision-making. Thus, BI is also defined as a decision support system (DSS).
The term ‘Business Intelligence’ (BI) provided the user with data and tools to answer any decision making the important question of an organization; it can be related to running the business or part of a business. In short, business intelligence is used for reporting the specified data of any business, which is very important and using which higher management of any organization will make the decision for the growth of their business. Normally below decisions can be decided by any organization from the Business Intelligence tool:
- BI is used to determine whether a business is running as per plan.
- BI is used to identify which things are actually going wrong.
- BI is used to take and monitor corrective actions.
- BI is used to identify the current trends of their business.
What are the different stages and benefits of Business Intelligence?
There are the following five stages of Business Intelligence:
- Data Source: It is about extracting data from multiple data sources.
- Data Analysis: It is about providing a proper analysis report based on useful knowledge from collecting data.
- Decision-Making Support: It is about properly using the information. It always targets to provide a proper graph on important events like take over, market changes, and poor staff performance.
- Situation Awareness: It is about filtering out irrelevant information and setting the remaining information in the context of the business and its environment.
- Risk Management: It is about discovering what corrective actions might be taken or decisions made at different times.
The following are different benefits of Business Intelligence:
- Improving decisions making.
- Speed up on decision making.
- Optimizing internal business process.
- Increase operational efficiency.
- Helping or driving new revenues.
- Gaining an advantage in terms of competitive markets with another close competitor.
What is the difference between data warehousing and Business Intelligence?
Data warehousing handles all methods of managing the development, implementation, and applications of a data warehouse or data mart containing metadata management, data acquisition, data cleansing, data transformation, storage management, data distribution, data archiving, operational documenting, analytical documenting, security management, backup/recovery planning, etc.
Business Intelligence is a set of software tools that allows an organization to analyze measurable methods of their business, such as sales performance, profitability, operational efficiency, effectiveness, of marketing campaigns, market penetration among certain user groups, cost trends, anomalies and exceptions, etc. Business Intelligence is used to encompass OLAP, data visualization, data mining, and query document tools.
What is a data warehouse? List the types of Data warehouse architectures.
A data warehouse is the electronic storage of an organization’s historical data for the purpose of data analytics. In other words, a data warehouse contains a wide variety of data that supports the decision-making process in an organization. There are mainly 3 types of data warehouse architectures:
| Types of Data Warehouse Architectures | |
| Single-tier architecture | The objective of a single layer is to minimize the amount of data stored by removing data redundancy. It is not frequently used in practice. |
| Two-tier architecture | This architecture separates physically available sources from the data warehouse.This architecture is not expandable & does not support a large number of end-users.Because of network limitations, this architecture faces connectivity issues. |
| Three-tier architecture | It is the most widely used architecture that is consist of the Top, Middle, and Bottom Tier.Bottom Tier: Usually a relational database of the Datawarehouse serves as the bottom tier where Data is cleansed, transformed, and loaded.Middle Tier: This application tier is an OLAP server & presents an abstracted view of the database which acts as a mediator between the end-user and the database.Top-Tier: The top tier is a front-end client layer that channels data out of the data warehouse. |
What is the main difference between Inmon and Kimball’s philosophies of Data Warehousing?
Both differ in the concept of building the Data Warehouse.
- Kimball views Data Warehousing as a constituency of data marts. Data marts are focused on delivering business objectives for departments in an organization, and the Data Warehouse is a conformed dimension of the data marts. Hence, a unified view of the enterprise can be obtained from the dimension modeling on a local departmental level.
- Inmon explains creating a Data Warehouse on a subject-by-subject area basis. Hence, the development of the Data Warehouse can start with data from the online store. Other subject areas can be added to the Data Warehouse as their needs arise. Point-of-sale (POS) data can be added later if management decides that it is necessary.
Hence, the process will be as follows:
Kimball > First Data Marts > Combined Ways > Data Warehouse
Inmon > First Data Warehouse > Data marts
Explain the architecture of a data warehouse.
A data warehouse is a single schema that organizes a heterogeneous collection of multiple data sources. There are two techniques for building a data warehouse. They are as follows:
Top-Down Approach in Data Warehouse:
Following are the major components:
- External Sources – An external source is a location from which data is collected, regardless of the data format. Structured, semi-structured, and unstructured data are all possibilities.
- Stage Area – Because the data gathered from external sources does not follow a specific format, it must be validated before being loaded into the data warehouse. ETL tool is used for this purpose in the stage area.
- Data-warehouse – After data has been cleansed, it is kept as a central repository in the data warehouse. The meta data is saved here, while the real data is housed in data marts. In this top-down approach, the data warehouse stores the data in its purest form.
- Data Marts – A data mart is a storage component as well. It maintains information about a single organization’s function that is managed by a single authority. Depending on the functions, an organization can have as many data marts as it wants.
- Data Mining – Data mining is the process of analyzing large amounts of data in a data warehouse. With the use of a data mining algorithm, it is used to discover hidden patterns in databases and data warehouses.
Bottom-Up Approach in Data Warehouse:
Following are the steps involved in the bottom-up approach:
- The data is first gathered from external sources (same as happens in top-down approach).
- The data is then imported into data marts rather than data warehouses after passing through the staging area (as stated above). The data marts are built first, and they allow for reporting. It focuses on a specific industry.
- After that, the data marts are incorporated into the data warehouse.
What are the advantages and disadvantages of the top-down approach to data warehouse architecture?
Following are the advantages of the top-down approach:
- Because data marts are formed from data warehouses, they have a consistent dimensional perspective.
- This methodology is also thought to be the most effective for corporate reforms. As a result, large corporations choose to take this method.
- It is simple to create a data mart from a data warehouse.
The disadvantage of the top-down approach is that the cost, time, and effort required to design and maintain it are all very expensive.
What are the advantages and disadvantages of the bottom-up approach to data warehouse architecture?
Following are the advantages of the bottom-up approach:
- The reports are generated quickly since the data marts are created first.
- We can fit a greater number of data marts here, allowing us to expand our data warehouse.
- In addition, the cost and effort required to build this model are quite minimal.
Because the dimensional view of data marts is not consistent as it is in the top-down approach, this model is not as strong as the top-down approach and this is a disadvantage of the bottom-up approach.
List any five applications of the data warehouse.
Some applications include financial services, banking services, customer goods, retail sectors, and controlled manufacturing.
What is Virtual Warehouse?
The view over an operational data warehouse is known as a virtual warehouse.
Why Data Warehouse is used?
For a long time in the past and also even today, Data warehouses are built to facilitate reporting on different key business processes of an organization, known as KPI. Today we often call this whole process of reporting data from data warehouses “Data Analytics”. Data warehouses also help to integrate data from different sources and show single-point-of-truth values about the business measures (e.g. enabling Master Data Management).
The data warehouse can be further used for data mining which helps with trend prediction, forecasts, pattern recognition, etc.
What are the advantages of a data warehouse?
Following are the advantages of using a data warehouse:
- Helps you save time:
- To stay ahead of your competitors in today’s fast-paced world of cutthroat competition, your company’s ability to make smart judgments quickly is critical.
- A Data warehouse gives you instant access to all of your essential data, so you and your staff don’t have to worry about missing a deadline. All you have to do now is deploy your data model to start collecting data in a matter of seconds. You can do this with most warehousing solutions without utilizing a sophisticated query or machine learning.
- With data warehousing, your company won’t have to rely on a technical professional to troubleshoot data retrieval issues 24 hours a day, seven days a week. You will save a lot of time this way.
- Enhances the quality of data:
- The high-quality data ensures that your company’s policies are founded on accurate information about your operations.
- You can turn data from numerous sources into a shared structure using data warehousing. You can assure the consistency and integrity of your company’s data this way. This allows you to spot and eliminate duplicate data, inaccurately reported data and disinformation.
- For your firm, implementing a data quality management program may be both costly and time-consuming. You can easily use a data warehouse to reduce the number of these annoyances while saving money and increasing the general productivity of your company.
- Enhances Business Intelligence (BI):
- Throughout your commercial endeavors, you can use a data warehouse to gather, absorb, and derive data from any source. As a result of the capacity to easily consolidate data from several sources, your BI will improve by leaps and bounds.
- Data standardization and Consistency are achieved:
- The uniformity of huge data is another key benefit of having central data repositories. In a similar manner, a data storage or data mart might benefit your company. Because data warehousing stores data from various sources in a consistent manner, such as a transactional system, each source will produce results that are synchronized with other sources. This ensures that data is of higher quality and homogeneous. As a result, you and your team can rest assured that your data is accurate, resulting in more informed corporate decisions.
- Enhances Data Security:
- A data warehouse improves security by incorporating cutting-edge security features into its design. For any business, consumer data is a vital resource. You can keep all of your data sources integrated and properly protected by adopting a warehousing solution. The risk of a data breach will be greatly reduced as a result of this.
- Ability to store historical data:
- Because a data warehouse can hold enormous amounts of historical data from operational systems, you can readily study different time periods and inclinations that could be game-changing for your business. You can make better corporate judgments about your business plans if you have the correct facts in your hands.
What are the disadvantages of using a data warehouse?
Following are the disadvantages of using a data warehouse:-
- Loading time of data resources is undervalued: We frequently underestimate the time it will take to gather, sanitize, and post data to the warehouse. Although some resources are in place to minimize the time and effort spent on the process, it may require a significant amount of the overall production time.
- Source system flaws that go unnoticed: After years of non-discovery, hidden flaws linked with the source networks that provide the data warehouse may be discovered. Some fields, for example, may accept nulls when entering new property information, resulting in workers inputting incomplete property data, even if it was available and relevant.
- Homogenization of data: Data warehousing also deals with data formats that are comparable across diverse data sources. It’s possible that some important data will be lost as a result.
What are the different types of data warehouses?
Following are the different types of data warehouses:
- Enterprise Data Warehouse:
- An enterprise database is a database that brings together the various functional areas of an organization in a cohesive manner. It’s a centralized location where all corporate data from various sources and apps can be accessed. They can be utilized for analytics and by everyone in the organization once they’ve been saved. The data can be categorized by subject, and access is granted according to the necessary division. The tasks of extracting, converting, and conforming are taken care of in an Enterprise Datawarehouse.
- Enterprise Datawarehouse’s purpose is to provide a comprehensive overview of any object in the data model. This is performed by finding and wrangling the data from different systems. This is then loaded into a model that is consistent and conformed. The data is acquired by Enterprise Datawarehouse, which can provide access to a single site where various tools can be used to execute analytical functions and generate various predictions. New trends or patterns can be identified by research teams, which can then be focused on to help the company expand.
- Operational Data Store (ODS):
- An operational data store is utilized instead of having an operational decision support system application. It facilitates data access directly from the database, as well as transaction processing. By checking the associated business rules, the data in the Operational Data Store may be cleansed, and any redundancy found can be checked and rectified. It also aids in the integration of disparate data from many sources so that business activities, analysis, and reporting may be carried out quickly and effectively while the process is still ongoing.
- The majority of current operations are stored here before being migrated to the data warehouse for a longer period of time. It is particularly useful for simple searches and little amounts of data. It functions as short-term or temporary memory, storing recent data. The data warehouse keeps data for a long time and also keeps information that is generally permanent.
- Data Mart:
- Data Mart is referred to as a pattern to get client data in a data warehouse environment. It’s a data warehouse-specific structure that’s employed by the team’s business domain. Every company has its own data mart, which is kept in the data warehouse repository. Dependent, independent, and hybrid data marts are the three types of data marts. Independent data marts collect data from external sources and data warehouses, whereas dependent data marts take data that has already been developed. Data marts can be thought of as logical subsets of a data warehouse.
What are the different types of data marts in the context of data warehousing?
Following are the different types of data mart in data warehousing:
- Dependent Data Mart: A dependent data mart can be developed using data from operational, external, or both sources. It enables the data of the source company to be accessed from a single data warehouse. All data is centralized, which can aid in the development of further data marts.
- Independent Data Mart: There is no need for a central data warehouse with this data mart. This is typically established for smaller groups that exist within a company. It has no connection to Enterprise Data Warehouse or any other data warehouse. Each piece of information is self-contained and can be used independently. The analysis can also be carried out independently. It’s critical to maintain a consistent and centralized data repository that numerous users can access.
- Hybrid Data Mart: A hybrid data mart is utilized when a data warehouse contains inputs from multiple sources, as the name implies. When a user requires an ad hoc integration, this feature comes in handy. This solution can be utilized if an organization requires various database environments and quick implementation. It necessitates the least amount of data purification, and the data mart may accommodate huge storage structures. When smaller data-centric applications are employed, a data mart is most effective.
Explain the difference between a data warehouse and a transactional system.
| Transactional System | Data Warehouse System |
| It is normally designed to process day-to-day data, so it mainly concentrates on high-volume transaction processing rather than backend reporting. | It is normally designed to process high-volume analytical reporting and subsequence. It is also elaborating on report generation. |
| It is normally process-driven, which means it depends on a business-specific task or execution. | It is actually subject-oriented, which means it loads data from a transactional system, then opens to use for any kind of analytical reporting, which helps the organization make proper decisions based on that specific subject. |
| It is normally handling current transactional data. | It is normally handling historical data. |
| Data within a transactional system can insert or update or delete in each task. | Data warehouse data is called as non-volatile, meaning that new data can be added regularly, but once loaded, those data are rarely changed. |
| In case of performance or speed, we should always prefer a transactional system for inserting, updating or deleting small volumes of data. | We should always prefer a data warehouse to fast retrieval of a relatively large volume of data. |
What are the characteristics of a data warehouse?
Following are the characteristics of a data warehouse:-
- Subject-oriented: Because it distributes information about a theme rather than an organization’s actual operations, a data warehouse is always subject-oriented. It is possible to do so with a certain theme. That is to say, the data warehousing procedure is intended to deal with a more defined theme. These themes could include sales, distribution, and marketing, for example. The focus of a data warehouse is never solely on present activities. Instead, it concentrates on demonstrating and analyzing evidence in order to reach diverse conclusions. It also provides a simple and precise demonstration around a specific theme by removing info that isn’t needed to make conclusions.
- Integrated: It is similar to subject orientation in that it is created in a dependable format. Integration entails the creation of a single entity to scale all related data from several databases. The data has to be stored in several data warehouses in a shared and widely accessible manner. A data warehouse is created by combining information from a variety of sources, such as a mainframe and a relational database. It must also have dependable naming conventions, formats, and codes. The utilization of a data warehouse allows for more effective data analysis. The consistency of name conventions, column scaling, and encoding structure, among other things, should be validated. The data warehouse integration handles a variety of subject-related warehouses.
- Time-Variant: Data is kept in this system at various time intervals, such as weekly, monthly, or annually. It discovers a number of time limits that are structured between massive datasets and held in the online transaction process (OLTP). Data warehouse time limitations are more flexible than those of operational systems. The data in the data warehouse is predictable over a set period of time and provides information from a historical standpoint. It contains explicit or implicit time elements. Another property of time-variance is that data cannot be edited, altered, or updated once it has been placed in the data warehouse.
- Non-volatile: The data in a data warehouse is permanent, as the name implies. It also means that when new data is put, it is not erased or removed. It incorporates a massive amount of data that is placed into logical business alteration between the designated quantity. It assesses the analysis in the context of warehousing technologies. Data is read-only and refreshed at scheduled intervals. This is useful for analyzing historical data and understanding how things work. It is not required to have a transaction process, a recapture mechanism, or a concurrency control mechanism. In a data warehouse environment, operations like delete, update, and insert that are performed in an operational application are lost.
Compare a database with Data Warehouse.
| Criteria | Database | Data Warehouse |
| Type of data | Relational or object-oriented data | Large volume with multiple data types |
| Data operations | Transaction processing | Data modeling and analysis |
| Dimensions of data | Two-dimensional data | Multidimensional data |
| Data design | ER-based and application-oriented database design | Star/Snowflake schema and subject-oriented database design |
| Size of the data | Small (in GB) | Large (in TB) |
| Functionality | High availability and performance | High flexibility and user autonomy |
A database uses a relational model to store data, whereas a Data Warehouse uses various schemas such as star schema and others. In star schema, each dimension is represented by only the one-dimensional table. Data Warehouse supports dimensional modeling, which is a design technique to support end-user queries.
What are the advantages of a cloud-based data warehouse?
Following are the advantages of a cloud-based data warehouse:
- Total cost of ownership is low: The low cost of cloud data warehouses is one of the reasons they are becoming more popular. On-premises data warehouses necessitate high-cost technology, lengthy upgrades, ongoing maintenance, and outage management.
- Increased performance and speed: To keep up with the expanding number of data sources, cloud data warehouses are crucial. Cloud data warehouses can easily and quickly integrate with additional data sources as needed, and deploy the updated solution to production. Cloud data warehouses significantly improve speed and performance, allowing IT to focus on more innovative projects.
- Enhanced Security: Cloud security engineers can create and iterate on precise data-protection measures. Furthermore, cloud encryption technologies such as multi-factor authentication make data transfer between regions and resources extremely safe.
- Improved Disaster Recovery: Physical assets are not required to prepare cloud data warehouses for disasters. Instead, almost all cloud data warehouses offer asynchronous data duplication and execute automatic snapshots and backups. This data is kept across multiple nodes, allowing duplicate data to be accessed at any time without stopping present activity.
What are the stages of Datawarehousing?
There are four stages of Datawarehousing:
- Offline Operational Database
- Offline Data Warehouse
- Real-Time Datawarehouse
- Integrated Datawarehouse
What is a snapshot with reference to Data Warehouse?
A snapshot refers to a complete visualization of data at the time of extraction. It occupies less space and can be used to back up and restore data quickly.
A snapshot is a process of knowing about the activities performed. It is stored in a report format from a specific catalog. The report is generated soon after the catalog is disconnected.
What is the very basic difference between data warehouse and operational databases?
A data warehouse contains historical information that is made available for analysis of the business whereas an operational database contains current information that is required to run the business.
List the Schema that a data warehouse system can implement.
A data Warehouse can implement star schema, snowflake schema, and fact constellation schema.
List the process that is involved in Data Warehousing.
Data Warehousing involves data cleaning, data integration, and data consolidations.
List the functions of data warehouse tools and utilities.
The functions performed by the Data warehouse tools and utilities are Data Extraction, Data Cleaning, Data Transformation, Data Loading, and Refreshing.
Define data analytics in the context of data warehousing.
Data analytics is the science of examining raw data with the purpose of drawing business-driven conclusions about that data. The role of a data warehouse is to enable data analysis.
What is a subject-oriented data warehouse?
Subject-oriented data warehouses are those that store data around a particular “subject” such as customer, sales, and product, among others.
What is ODS?
ODS stands for Operational Data Store. it is essentially a repository of real-time operational data. An operational data store (ODS) is a database designed to integrate data from multiple sources for additional operations on the data. Unlike a master data store, the data is not sent back to operational systems. It may be passed for further operations and to the Data Warehouse for reporting.
In ODS, data can be scrubbed, resolved for redundancy, and checked for compliance with the corresponding business rules. This data store can be used for integrating disparate data from multiple sources so that business operations, analysis, and reporting can be carried out. This is the place where most of the data used in the current operation is housed before it’s transferred to the Data Warehouse for longer-term storage or archiving.
An ODS is designed for relatively simple queries on small amounts of data (such as finding the status of a customer order), rather than the complex queries on large amounts of data typical of the Data Warehouse.
An ODS is similar to short-term memory where it only stores very recent information. On the contrary, the Data Warehouse is more like long-term memory, storing relatively permanent information.
What is the difference between OLTP and OLAP?
OLTP is the transaction system that collects business data. Whereas OLAP is the reporting and analysis system on that data. OLTP systems are optimized for INSERT, and UPDATE operations and therefore highly normalized. On the other hand, OLAP systems are deliberately denormalized for fast data retrieval through SELECT operations.
Explanatory Note:
In a departmental shop, when we pay the prices at the check-out counter, the salesperson at the counter keys-in all the data into a “Point-Of-Sales” machine. That data is transaction data and the related system is an OLTP system.
On the other hand, the manager of the store might want to view a report on out-of-stock materials, so that he can place a purchase order for them. Such report will come out from the OLAP system.
What does OLAP stand for?
OLAP stands for On-Line Analytical Processing. It is a system that collects, manages, and processes multi-dimensional data for analysis and management.
What does OLTP stand for?
OLTP stands for On-Line Transaction Processing. It is a system that modifies the data whenever it is received, by a large number of concurrent users.
List the types of OLAP servers.
- Relational OLAP
- Multidimensional OLAP
- Hybrid OLAP
- Specialized SQL Servers
| Sr.No. | Data Warehouse (OLAP) | Operational Database (OLTP) |
| 1 | Involves historical processing of information. | Involves day-to-day processing. |
| 2 | OLAP systems are used by knowledge workers such as executives, managers, and analysts. | OLTP systems are used by clerks, DBAs, or database professionals. |
| 3 | Useful in analyzing the business. | Useful in running the business. |
| 4 | It focuses on Information out. | It focuses on Data in. |
| 5 | Based on Star Schema, Snowflake, Schema, and Fact Constellation Schema. | Based on Entity-Relationship Model. |
| 6 | Contains historical data. | Contains current data. |
| 7 | Provides summarized and consolidated data. | Provides primitive and highly detailed data. |
| 8 | Provides a summarized and multidimensional view of data. | Provides a detailed and flat relational view of data. |
| 9 | Number of users is in the hundreds. | The number of users is in the thousands. |
| 10 | Number of records accessed is in millions. | A number of records accessed is in tens. |
| 11 | Database size is from 100 GB to 1 TB | Database size is from 100 MB to 1 GB. |
| 12 | Highly flexible. | Provides high performance. |
Which one is faster, Multidimensional OLAP or Relational OLAP?
Multidimensional OLAP is faster than Relational OLAP.
List the functions performed by OLAP.
OLAP performs functions such as roll-up, drill-down, slice, dice, and pivot
What do you mean by Data Extraction?
Data extraction means gathering data from multiple heterogeneous sources.
What is metadata and why is it used for?
The definition of Metadata is data about data. Metadata is the context that gives information a richer identity and forms the foundation for its relationship with other data. It can also be a helpful tool that saves time, keeps organized, and helps make the most of the files working with. Structural Metadata is information about how an object should be categorized to fit into a larger system with other objects. Structural Metadata establishes a relationship with other files to be organized and used in many ways.
Administrative Metadata is information about the history of an object, who used to own it, and what can be done with it. Things like rights, licenses, and permissions. This information is helpful for people managing and taking care of an object.
One point of data only gains its full meaning when it’s put in the right context. And the better-organized Metadata will reduce the searching time significantly.
What is Fact?
A fact is something that is quantifiable (Or measurable). Facts are typically (but not always) numerical values that can be aggregated.
Types of Facts
There are three types of facts:
- Summative facts: Summative facts are used with aggregation functions such as sum (), average (), etc.
- Semi summative facts: There are small numbers of quasi-summative fact aggregation functions that will apply.
For example, consider bank account details. We also cannot also apply () for a bank balance which will not have useful results, but the minimum() and maximum() functions return useful information. - Non-additive facts: We cannot use numerical aggregation functions such as sum (), average (), on non-additive facts. For non-additive facts, a ratio or percentage is used.
Type of fact tables
Transactional Fact Table: This is a very basic and fundamental view of corporate processes. It can be used to depict the occurrence of an event at any given time. The facts measure are only valid at that specific time and for that specific incident. “One row per line in a transaction,” according to the grain associated with the transaction table. It typically comprises data at the detailed level, resulting in a huge number of dimensions linked with it. It captures the smallest or atomic level of dimension measurement. This allows the table to provide users with extensive dimensional grouping, roll-up, and drill-down reporting features. It’s packed yet sparse at the same time. It can also be big at the same time, depending on the number of events (transactions) that have occurred.
Snapshot Fact Table: The snapshot depicts the condition of things at a specific point in time, sometimes known as a “picture of the moment.” It usually contains a greater number of non-additive and semi-additive information. It aids in the examination of the company’s overall performance at regular and predictable times. Unlike the transaction fact table, which adds a new row for each occurrence of an event, this represents the performance of an activity at the end of each day, week, month, or any other time interval. However, to retrieve the detailed data in the transaction fact table, snapshot fact tables or periodic snapshots rely on the transaction fact table. The periodic snapshot tables are typically large and take up a lot of space.
Accumulating Fact Table: These are used to depict the activity of any process with a well-defined beginning and end. Multiple data stamps are commonly found in accumulating snapshots, which reflect the predictable stages or events that occur over the course of a lifespan. There is sometimes an extra column with the date that indicates when the row was last updated.
What is a conformed fact?
A conformed fact is a type of table that will be used across multiple data marts and multiple fact tables.
What is a dimension?
A dimension is something that qualifies a quantity (measure). For an example, consider this: If I just say… “20kg”, it does not mean anything. But if I say, “20kg of Rice (Product) is sold to Ramesh (customer) on 5th April (date)”, then that gives a meaningful sense. These product, customer and dates are some dimension that qualified the measure – 20kg. Dimensions are mutually independent. Technically speaking, a dimension is a data element that categorizes each item in a data set into non-overlapping regions.
What is the core dimension?
The core dimension is a Dimension table, which is used, is dedicated for a single fact table or Data Mart.
What are the different types of “dimension”?
- Conformed dimension
- Junk dimension
- Degenerated dimension
- Role Playing dimension
What are conformed dimensions?
Conformed dimensions are the dimensions that can be used across multiple data marts in combination with multiple fact tables accordingly.
A conformed dimension is a dimension that has exactly the same meaning and content when being referred from different fact tables. It can refer to multiple tables in multiple data marts within the same organization.
A conformed dimension is a dimension that has the same meaning to every fact with which it relates. Conformed dimensions allow facts and measures to be categorized and described in the same way across multiple facts and/or data marts, ensuring consistent reporting across the enterprise.
A conformed dimension can exist as a single dimension table that relates to multiple fact tables within the same data warehouse, or as identical dimension tables in separate data marts. Date is a common conformed dimension because its attributes (day, week, month, quarter, year, etc.) have the same meaning when joined to any fact table. A conformed product dimension with product name, description, SKU, and other common attributes could exist in multiple data marts, each containing data for one store in a chain.
Using conformed dimensions makes the whole ETL process more efficient as it does not have to do multiple processes to process the same dimensions-related data (for example customer data) more than once. It also makes dimensions extensible (add more attributes to a dimension): If there is one customer dimension, it makes the whole process of changing the dimensional attributes easier and less complex. It will have minimal impact on the queries and associated meta-data, reports and views built on the dimension. In short, the more different versions of a dimension, the more work one needs to do to handle any change.
There may be times when you have more than one fact table in a cube, and a user may want to compare measures in the fact tables on a scorecard. You can only do this if there is a conformed dimension between the fact tables.
Reference Dimensions
A reference dimension occurs when the key column for the dimension is joined indirectly to the fact table through a key in another dimension table. This results in a snowflake schema design.
The following figure shows one fact table named InternetSales, and two dimension tables called Customer (regular or intermediate dimension) and Geography (reference dimension), in a snowflake schema:

Note that for performance reasons, it’s better to not use reference dimensions. Instead, merge the Geography info into the Customer table (see Denormalizing dimension tables). So the Customer table would add the fields City, StateProvidinceCode, and StateProvinceName populated by the ETL, resulting in one table and a true Star Schema.
Many-to-Many Dimensions
In SSAS, data structures do not always conform to the snowflake or star schema model where one fact is associated with a single dimension member. For example, consider the example of financial transactions in accounts that can have one or more customers. This can be modeled as:
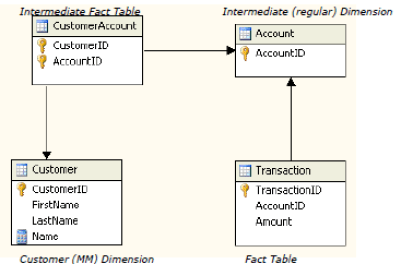
The relationship between transaction and customer is a many-to-many relationship. A single transaction can be associated with many customers and each customer can be associated with many transactions. For example, I can have an individual account as well as a joint account with my wife. So a single transaction in our joint account means that transaction is associated with many customers (my wife and I), and each customer (me) can be associated with many transactions (all my transactions for my individual account and my joint account).
In the example picture above, there are two dimensions and two fact tables. The Customer dimension is the Many-to-Many (MM) dimension to the Transaction fact table. The CustomerAccount measure group is the Intermediate Fact Table (called a bridge table in the relational world) and Account is the intermediate dimension. The intermediate fact table is the fact table that relates the Many-to-Many dimension to the regular dimension. In this case, it relates the Customer dimension to Account dimension. The Transaction fact table is related to Customer in the conventional manner, but is also related to the Customer dimension via a many-to-many relationship.
What is junk dimension?
In scenarios where certain data may not be appropriate to store in the schema, the data (or attributes) can be stored in a junk dimension. The nature of the data of junk dimension is usually Boolean or flag values.
A single dimension is formed by lumping a number of small dimensions. This is called a junk dimension. Junk dimension has unrelated attributes. The process of grouping random flags and text attributes in a dimension by transmitting them to a distinguished sub-dimension is related to junk dimension.
What is a degenerate dimension?
In a data warehouse, a degenerate dimension is a dimension key in the fact table that does not have its own dimension table. Degenerate dimensions commonly occur when the fact table’s grain is a single transaction (or transaction line).
What is a Roleplay Dimension?
Roleplay Dimension: Role-play dimension refers to the dimension table that has many relationships with the fact table. In other words, it occurs when the same dimension key and all of its associated attributes are linked to a large number of foreign keys in the fact table. Within the same database, it might serve several roles.
Dimensions are often recycled for multiple purposes within the same database. For instance, a “Date” dimension can be used for “Date of Sale”, as well as “Date of Delivery”, or “Date of Hire”. This is often referred to as a “role-playing dimension”.
Basically, if the same dimension is used more than once with different names in the cube then it is called the role- playing dimension. For example, suppose we are designing a cube which captures purchasing data, we can have multiple dates in this scenario like Order Date, Ship Date, Order Received Date, etc. In these kinds of situations we need to have different date keys stored in the fact tables (like OrderDateKey, ShipDateKey etc…) to get the different date information while browsing the cube.
To handle this situation we do not need to create the “n” number of database dimensions for dates in the cube. What we can do instead is to just create one date database dimension when designing the cube and others can use the same dimension but with a different name. For example, we can create a database dimension called “DimDate” and other date dimensions can be created by using the same database dimension but with different names like “DimShipDate”, “DimOrderReceivedDate”, etc. And these remaining date dimensions are created as cube dimensions (In SSAS, under the Cube Structure Tab–>In the Dimension Section–>Right Click on the Cube–>Add Cube Dimension–>Select existing “DimDate”–>Give another name, for example “DimShipDate”, then go to the “Dimension Usage” tab and define the relationship).
The key thing here is to keep in mind we should have only one date database dimension and other date dimensions should be created as cube dimensions. This means in the cube we will have many different date dimensions but behind the scenes we are only using one database dimension, which prevents duplication of data. This also improves cube processing time as you are only processing one database dimension instead of multiple database dimensions.
In this illustrated example, the DimDate table serves as three different roles, the order date, due date and the ship date:
What are the different types of SCDs used in Data Warehousing?
SCDs (slowly changing dimensions) are the dimensions in which the data changes slowly, rather than changing regularly on a time basis.
Three types of SCDs are used in Data Warehousing:
- SCD1: It is a record that is used to replace the original record even when there is only one record existing in the database. The current data will be replaced and the new data will take its place.
- SCD2: It is the new record file that is added to the dimension table. This record exists in the database with the current data and the previous data that is stored in the history.
- SCD3: This uses the original data that is modified to the new data. This consists of two records: one record that exists in the database and another record that will replace the old database record with the new information.
- Type 4 – History Table shows the current value in the dimension table. All changes are tracked and stored in a separate table.
- Hybrid SCD – Hybrid SDC utilizes techniques from SCD Types 1, 2, and three to trace change.
Only types 0, 1, and a couple of are widely used, while the others are applied for very specific requirements.
What is Hybrid SCD?
Hybrid SCDs are a combination of both SCD1 and SCD2.
It may happen that in a table, some columns are important and we need to track changes for them, i.e., capture the historical data for them, whereas in some columns even if the data changes we do not have to bother. For such tables, we implement Hybrid SCDs, wherein some columns are Type 1 and some are Type 2.
What is a mini dimension?
Mini dimensions are dimensions that are used when a large number of rapidly changing attributes are separated into smaller tables.
What are the different methods of loading dimension tables?
There are two different methods to load data in dimension tables:
- Conventional (slow): All the constraints and keys are validated against the information before, it is loaded, and this method data integrity is maintained.
- Direct (fast): All the constraints and keys are disabled before the information is loaded. Once the information is loaded, it is validated against all the constraints and keys. If the data is found invalid, it is not contained in the index, and all the future processes are skipped in this data.
Describe the foreign key columns in fact tables and dimension tables?
Foreign keys of dimension tables are the primary key of entity tables.
Foreign keys of fact tables are the primary key of dimension tables.
Define fact-less fact.
Fact-less fact is a fact table that does not contain any value. Such a table only contains keys from different dimension tables.
What is a data cube?
A data cube helps represent data in multiple facets. Data cubes are defined by dimensions and facts.
What is a data mart?
Data mart is a subset of organizational data. In other words, it is a collection of data specific to a particular group within an organization.
What is data aggregation?
Data aggregation is the broad definition for any process that enables information gathering expression in a summary form, for statistical analysis.
What is summary information?
Summary Information is the location within data warehouse where predefined aggregations are stored.
What do you mean by data purging in the context of data warehousing?
Data purging is a term that describes techniques for permanently erasing and removing data from a storage space. Data purging, which is typically contrasted with data deletion, involves a variety of procedures and techniques. Purging removes data permanently and frees up memory or storage space for other purposes, whereas deletion is commonly thought of as a temporary preference. Automatic data purging features are one of the methods for data cleansing in database administration. Some Microsoft products, for example, feature an automatic purge strategy that uses a circular buffer mechanism, in which older data is purged to create room for fresh data. Administrators must manually remove data from the database in other circumstances
Explore Curriculum
What does data purging mean?
Data purging is a process, involving methods that can erase data permanently from the storage. Several techniques and strategies are used for data purging.
The process of data purging often contrasts with data deletion. Deleting data is more of a temporary process, while data purging permanently removes data. This, in turn, frees up storage and/or memory space, which can be utilized for other purposes.
The purging process allows us to archive data even if it is permanently removed from the main source, giving us an option to retrieve the data from the archive if it is needed. The deleting process also permanently removes the data but does not necessarily involve keeping a backup, and it generally involves insignificant amounts of data.
Define metadata?
Metadata is simply defined as data about data. In other words, we can say that metadata is the summarized data that leads us to detailed data.
What does Metadata Respiratory contain?
Metadata respiratory contains a definition of data warehouse, business metadata, operational metadata, data for mapping from the operational environment to data warehouse, and the algorithms for summarization.
Q: How many dimensions are selected in Slice operation?
Only one dimension is selected for the slice operation.
Q: How many dimensions are selected in dice operation?
For dice operation two or more dimensions are selected for a given cube.
What is the purpose of data profiling in an ETL process? Which steps in the data profiling process are the most important?
Data profiling tasks help maintain data quality. During this phase, a number of issues are checked for and resolved. The most important are:
- Keys and unique identification of a row. Rows to be inserted must be unique. Often businesses use some natural keys to identify a given row, but developers must verify that this is sufficient.
- Data types. Column names that suggest a certain type should be scrutinized: Will the indicated type change the meaning of the column, or potentially allow for data loss? Data types can also affect post-ETL performance: Even if it doesn’t matter much during the process, text loaded into a variable-length string column will, on some RDBMSes, cause a performance hit when users start querying the target.
- Relationships among data. It’s important to know how tables relate to each other. It might require additional modeling to join some parts of data to avoid losing important structural information. Another thing is to understand the cardinality of a relationship, as it determines how the tables involved are going to be joined in the future.
What are three different approaches to implementing row versioning?
Maintaining row history requires implementing a versioning policy. The three most popular types are:
- Insert a new record: In this case, updated information about the row is stored, but it’s not linked to any other information—it’s treated as a new row. Usually, in this case, there is also an additional column (or even more than one) to easily identify the most recent change. It could be, for example, a “current record” flag, a “reason for change” text field, or a “valid from/until” pair of date-times (or tsrange, perhaps).
- Additional column(s): Here the old value of a changed column is moved to the additional column (e.g. old_amount) and the new value takes the place of the original (e.g. amount.)
- History table: First a history table is created, separate from the primary table. Then we have multiple options for how to load data into this table. One of them is to create DML triggers. Functionality provided by RDBMS vendors—like change data capture features—can be handy here. Such features can be far more efficient than triggers, like when they keep track of changes directly in the transaction log, which is responsible for keeping information about any changes made to the database. SQL Server—in particular, 2016 and beyond—can track changes using system-versioned temporal tables. This feature maintains a full history table next to the most current one: The main temporal table keeps only the most recent version of the data, but it is linked to the history table, which contains all previous versions.
What is a “staging” area, why is it needed?
Staging is an optional, intermediate storage area in ETL processes. The decision “to stage or not to stage” can be split into four main considerations:
- Auditing purposes. Thanks to the staging area we are able to compare the original input file with our outcome. It’s extremely useful, especially when the source system overwrites the history (e.g., flat files on an FTP server are being overwritten every day.)
- Recovery needs. Even though PCs are getting faster—typically having more bandwidth of nearly every form—there are still some legacy systems and environments that are not performant to extract data from. It’s good practice to store the data as soon as it’s extracted from the source system. This way staging objects can act as recovery checkpoints, avoiding the situation where a process needs to be completely rerun when it fails at 90 percent done.
- Backup. In the case of a failure, the staging area can be used to recover data in a target system.
- Load performance. If the data has to be loaded as soon as possible into the system, staging is the way to go. Developers load data as-is into the staging area, then perform various transformations on it from there. It’s far more efficient than transforming the data on-the-fly before loading it into the target system, but the tradeoff here is higher disk space usage.
How would you prepare and develop incremental loads?
The most common way to prepare for incremental load is to use information about the date and time a record was added or modified. It can be designed during the initial load and maintained later, or added later in an ETL process based on business logic.
It is very important to make sure that the fields used for this are not modified during the process and that these can be trusted.
The next step is to decide how to capture the changes, but the underlying basics are always the same: Comparing the last modified date to the maximum date already existing in the target, and then taking all records that are larger.
Another option is to prepare a process for delta loads, which would compare already existing records with new ones, and only load the differences. But this is not the most efficient way.
How would you update a big table, i.e. one having over 10 million rows?
The most common way is to use batches: Split one big query into smaller ones, e.g. 10 thousand rows in a batch:
DECLARE @id_control INT = 0 –current batch
,@batchSize INT = 10000 –size of the batch
,@results INT = 1 –row count after batch
— if 0 rows returned, exit the loop
WHILE (@results > 0)
BEGIN
UPDATE [table]
SET [column] = [value]
WHERE [PrimaryKey column] > @id_control
AND [PrimaryKey column] <= @id_control + @batchSize
— the latest row count
SET @results = @@ROWCOUNT
— start next batch
SET @id_control = @id_control + @batchSize
END
If the table is too big, a better option might be to create a new table, insert the changed data, and then switch tables.
What’s better from a performance point of view: Filtering data first and then joining it with other sources, or joining it first and then filtering?
It’s better to filter data first and then join it with other sources.
A good way to improve ETL process performance is to get rid of unwanted data as soon as possible in the process. It reduces the time spent on data transfer and/or I/O and memory processing.
The general rule is to reduce the number of processed rows and to avoid transforming data that never gets to the target.
How would you prepare logging for ETL process?
Logging is extremely important to keep track of all changes and failures during a load. The most common ways to prepare for logging are to use flat files or a logging table. That is, during the process, counts, timestamps, and metadata about the source and target are added and then dumped into a flat file or table.
This way the load can be checked for invalid runs. When such a table or file exists, the next step would be to prepare notifications. This could be a report, or a simple formatted email, describing the load as soon as it finishes (e.g. the number of processed records compared to the previous load.)
To achieve that in an ETL process, a developer would add event handlers (SSIS) or use variables (like the system variable @@ROWCOUNT in Transact-SQL) to keep track of inserted, updated, and deleted records.
When using SSIS we can also keep track of every processed package using the SSISDB database:
SELECT TOP 10000 o.Object_Name [Project Name]
,REPLACE(e.package_name , ‘.dtsx’, ”) [Package Name]
,o.start_time [Start Time]
,o.end_time [End Time]
,e.message_source_name [Message Source Name]
,e.event_name [Event Name]
,e.subcomponent_name [Subcomponent Name]
,e.message_code [Message Code]
,m.message_time [Event Time]
,m.message [Error Message]
,m.message_time [Error Date]
,o.caller_name [Caller Name]
,o.Stopped_By_Name [Stopped By]
,ROW_NUMBER() OVER (PARTITION BY m.operation_id ORDER BY m.message_source_type DESC [Source Type Order]
FROM SSISDB.internal.operations o
JOIN SSISDB.internal.operation_messages m
ON o.operation_id = m.operation_id
JOIN SSISDB.internal.event_messages e
ON m.operation_id = e.operation_id
AND m.operation_message_id = e.event_message_id
WHERE o.Object_Name LIKE ‘%[object name]%’ — database
AND event_name LIKE ‘%Error%’
ORDER BY o.end_time DESC
,o.Object_Name
,[Source Type Order] ASC
Other than flat files and the database itself, ETL tools offer native notification and logging features: for example, a dashboard indicating the current load status.
Mention the differences between Data Mining and Data Profiling?
| Data Mining | Data Profiting |
| Data mining is the process of discovering relevant information that has not yet been identified before. | Data profiling is done to evaluate a dataset for its uniqueness, logic, and consistency. |
| In data mining, raw data is converted into valuable information. | It cannot identify inaccurate or incorrect data values. |
What are the best methods for data cleaning?
- Create a data cleaning plan by understanding where the common errors take place and keep all the communications open.
- Before working with the data, identify and remove the duplicates. This will lead to an easy and effective data analysis process.
- Focus on the accuracy of the data. Set cross-field validation, maintain the value types of data, and provide mandatory constraints.
- Normalize the data at the entry point so that it is less chaotic. You will be able to ensure that all information is standardized, leading to fewer errors on entry.
Define the term ‘Data Wrangling in Data Analytics.
Data Wrangling is the process wherein raw data is cleaned, structured, and enriched into a desired usable format for better decision making. It involves discovering, structuring, cleaning, enriching, validating, and analyzing data. This process can turn and map out large amounts of data extracted from various sources into a more useful format. Techniques such as merging, grouping, concatenating, joining, and sorting are used to analyze the data. Thereafter it gets ready to be used with another dataset.
What are the various steps involved in any analytics project?
This is one of the most basic data analyst interview questions. The various steps involved in any common analytics projects are as follows:
- Understanding the Problem → Understand the business problem, define the organizational goals, and plan for a lucrative solution.
- Collecting Data → Gather the right data from various sources and other information based on your priorities.
- Cleaning Data → Clean the data to remove unwanted, redundant, and missing values, and make it ready for analysis.
- Exploring and Analyzing Data → Use data visualization and business intelligence tools, data mining techniques, and predictive modeling to analyze data.
- Interpreting the Results → Interpret the results to find out hidden patterns, future trends, and gain insights.
What are the common problems that data analysts encounter during analysis?
The common problems steps involved in any analytics project are:
- Handling duplicate
- Collecting the meaningful right data and the right time
- Handling data purging and storage problems
- Making data secure and dealing with compliance issues
Which are the technical tools that you have used for analysis and presentation purposes?
As a data analyst, you are expected to know the tools mentioned below for analysis and presentation purposes. Some of the popular tools you should know are:
- MS SQL Server, MySQL → For working with data stored in relational databases
- MS Excel, Tableau → For creating reports and dashboards
- Python, R, SPSS → For statistical analysis, data modeling, and exploratory analysis
- MS PowerPoint → For presentation, displaying the final results and important conclusions
What is the significance of Exploratory Data Analysis (EDA)?
- Exploratory data analysis (EDA) helps to understand the data better.
- It helps you obtain confidence in your data to a point where you’re ready to engage a machine learning algorithm.
- It allows you to refine your selection of feature variables that will be used later for model building.
- You can discover hidden trends and insights from the data.
Explain descriptive, predictive, and prescriptive analytics.
| Descriptive | Predictive | Prescriptive |
| It provides insights into the past to answer “what has happened” | Understands the future to answer “what could happen” | Suggest various courses of action to answer “what should you do” |
| Uses data aggregation and data mining techniques | Uses statistical models and forecasting techniques | Uses simulation algorithms and optimization techniques to advise possible outcomes |
| Example: An ice cream company can analyze how much ice cream was sold, which flavors were sold, and whether more or less ice cream was sold than the day before | Example: An ice cream company can analyze how much ice cream was sold, which flavors were sold, and whether more or less ice cream was sold than the day before | Example: Lower prices to increase the sale of ice creams, produce more/fewer quantities of a specific flavor of ice cream |

Leave a comment